Dashboard
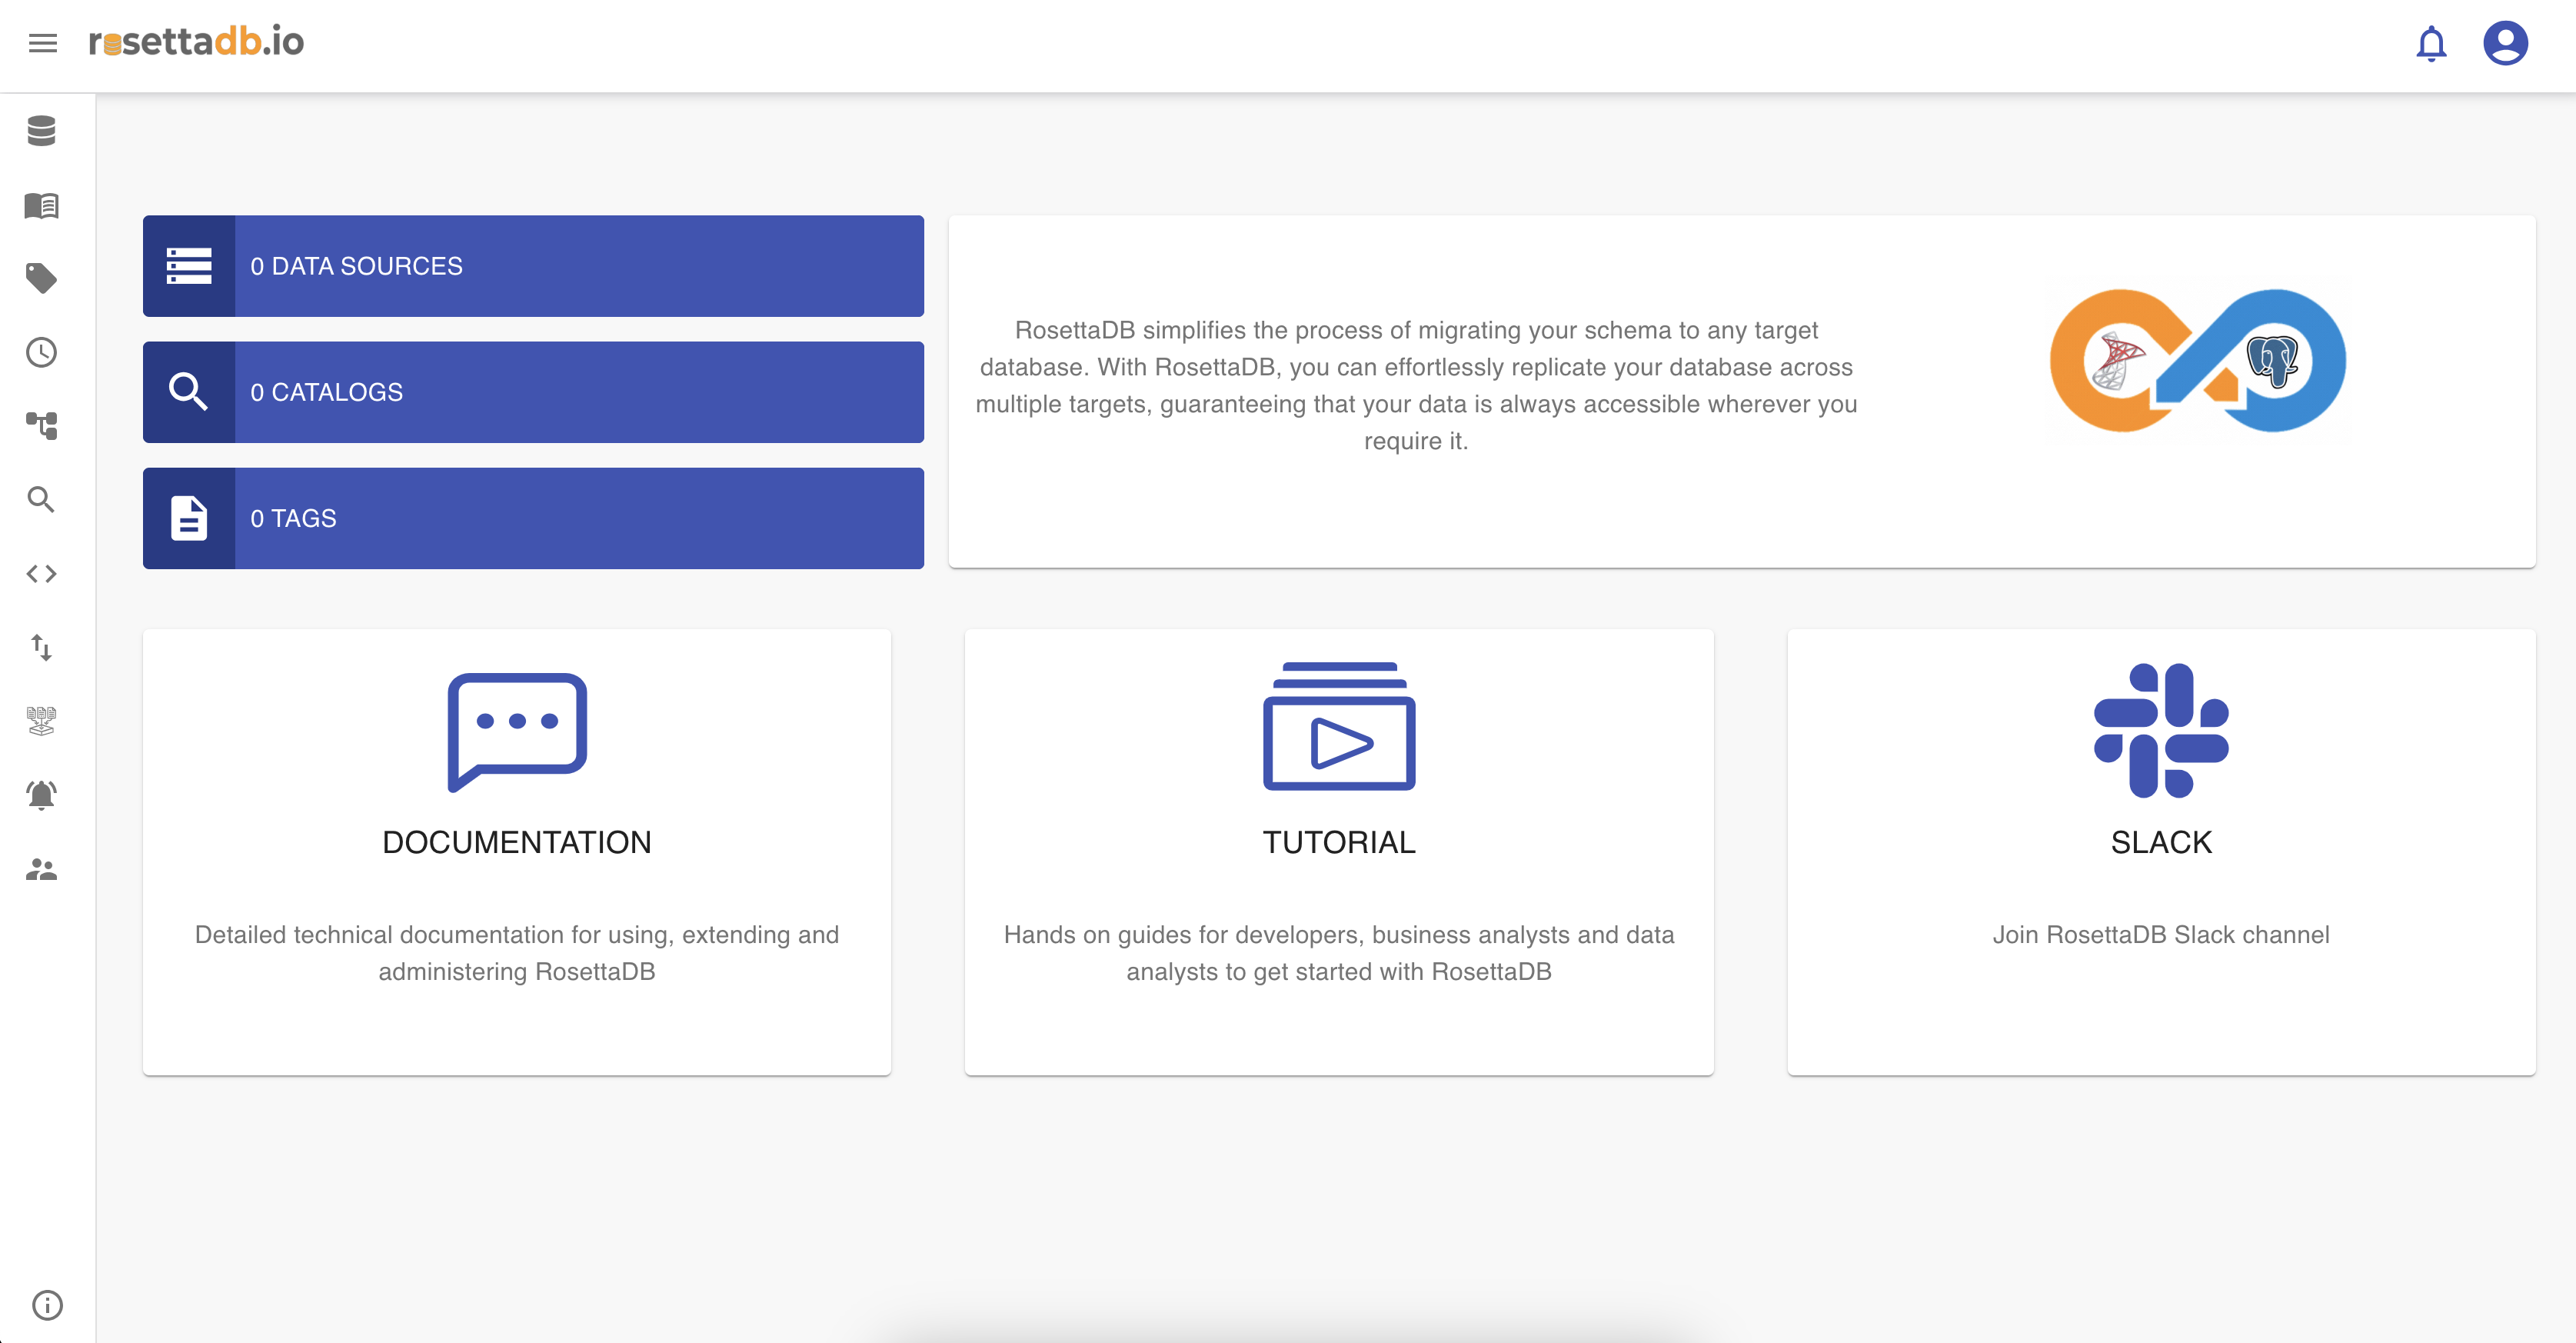
The Rosetta dashboard provides users with an overview of general statistics, including the number of data sources crawled, as well as the count of tables and tags available. Users can conveniently add a data source, explore catalogs, or search for metadata tags directly from the dashboard. Moreover, users have the option to download the Rosetta driver directly from the dashboard. To facilitate users in utilizing the product effectively, comprehensive resources such as User Guides, Tutorials, and Documentation are available.
Example
When the user opens Rosetta, the first thing they encounter is the dashboard. As depicted in the image below, there are currently no data sources, catalogs, or tags created yet in Rosetta.

To modify the view of the dashboard, as previously mentioned, users can either add data sources or catalogs directly from the dashboard or add them through the menu tabs on the left.
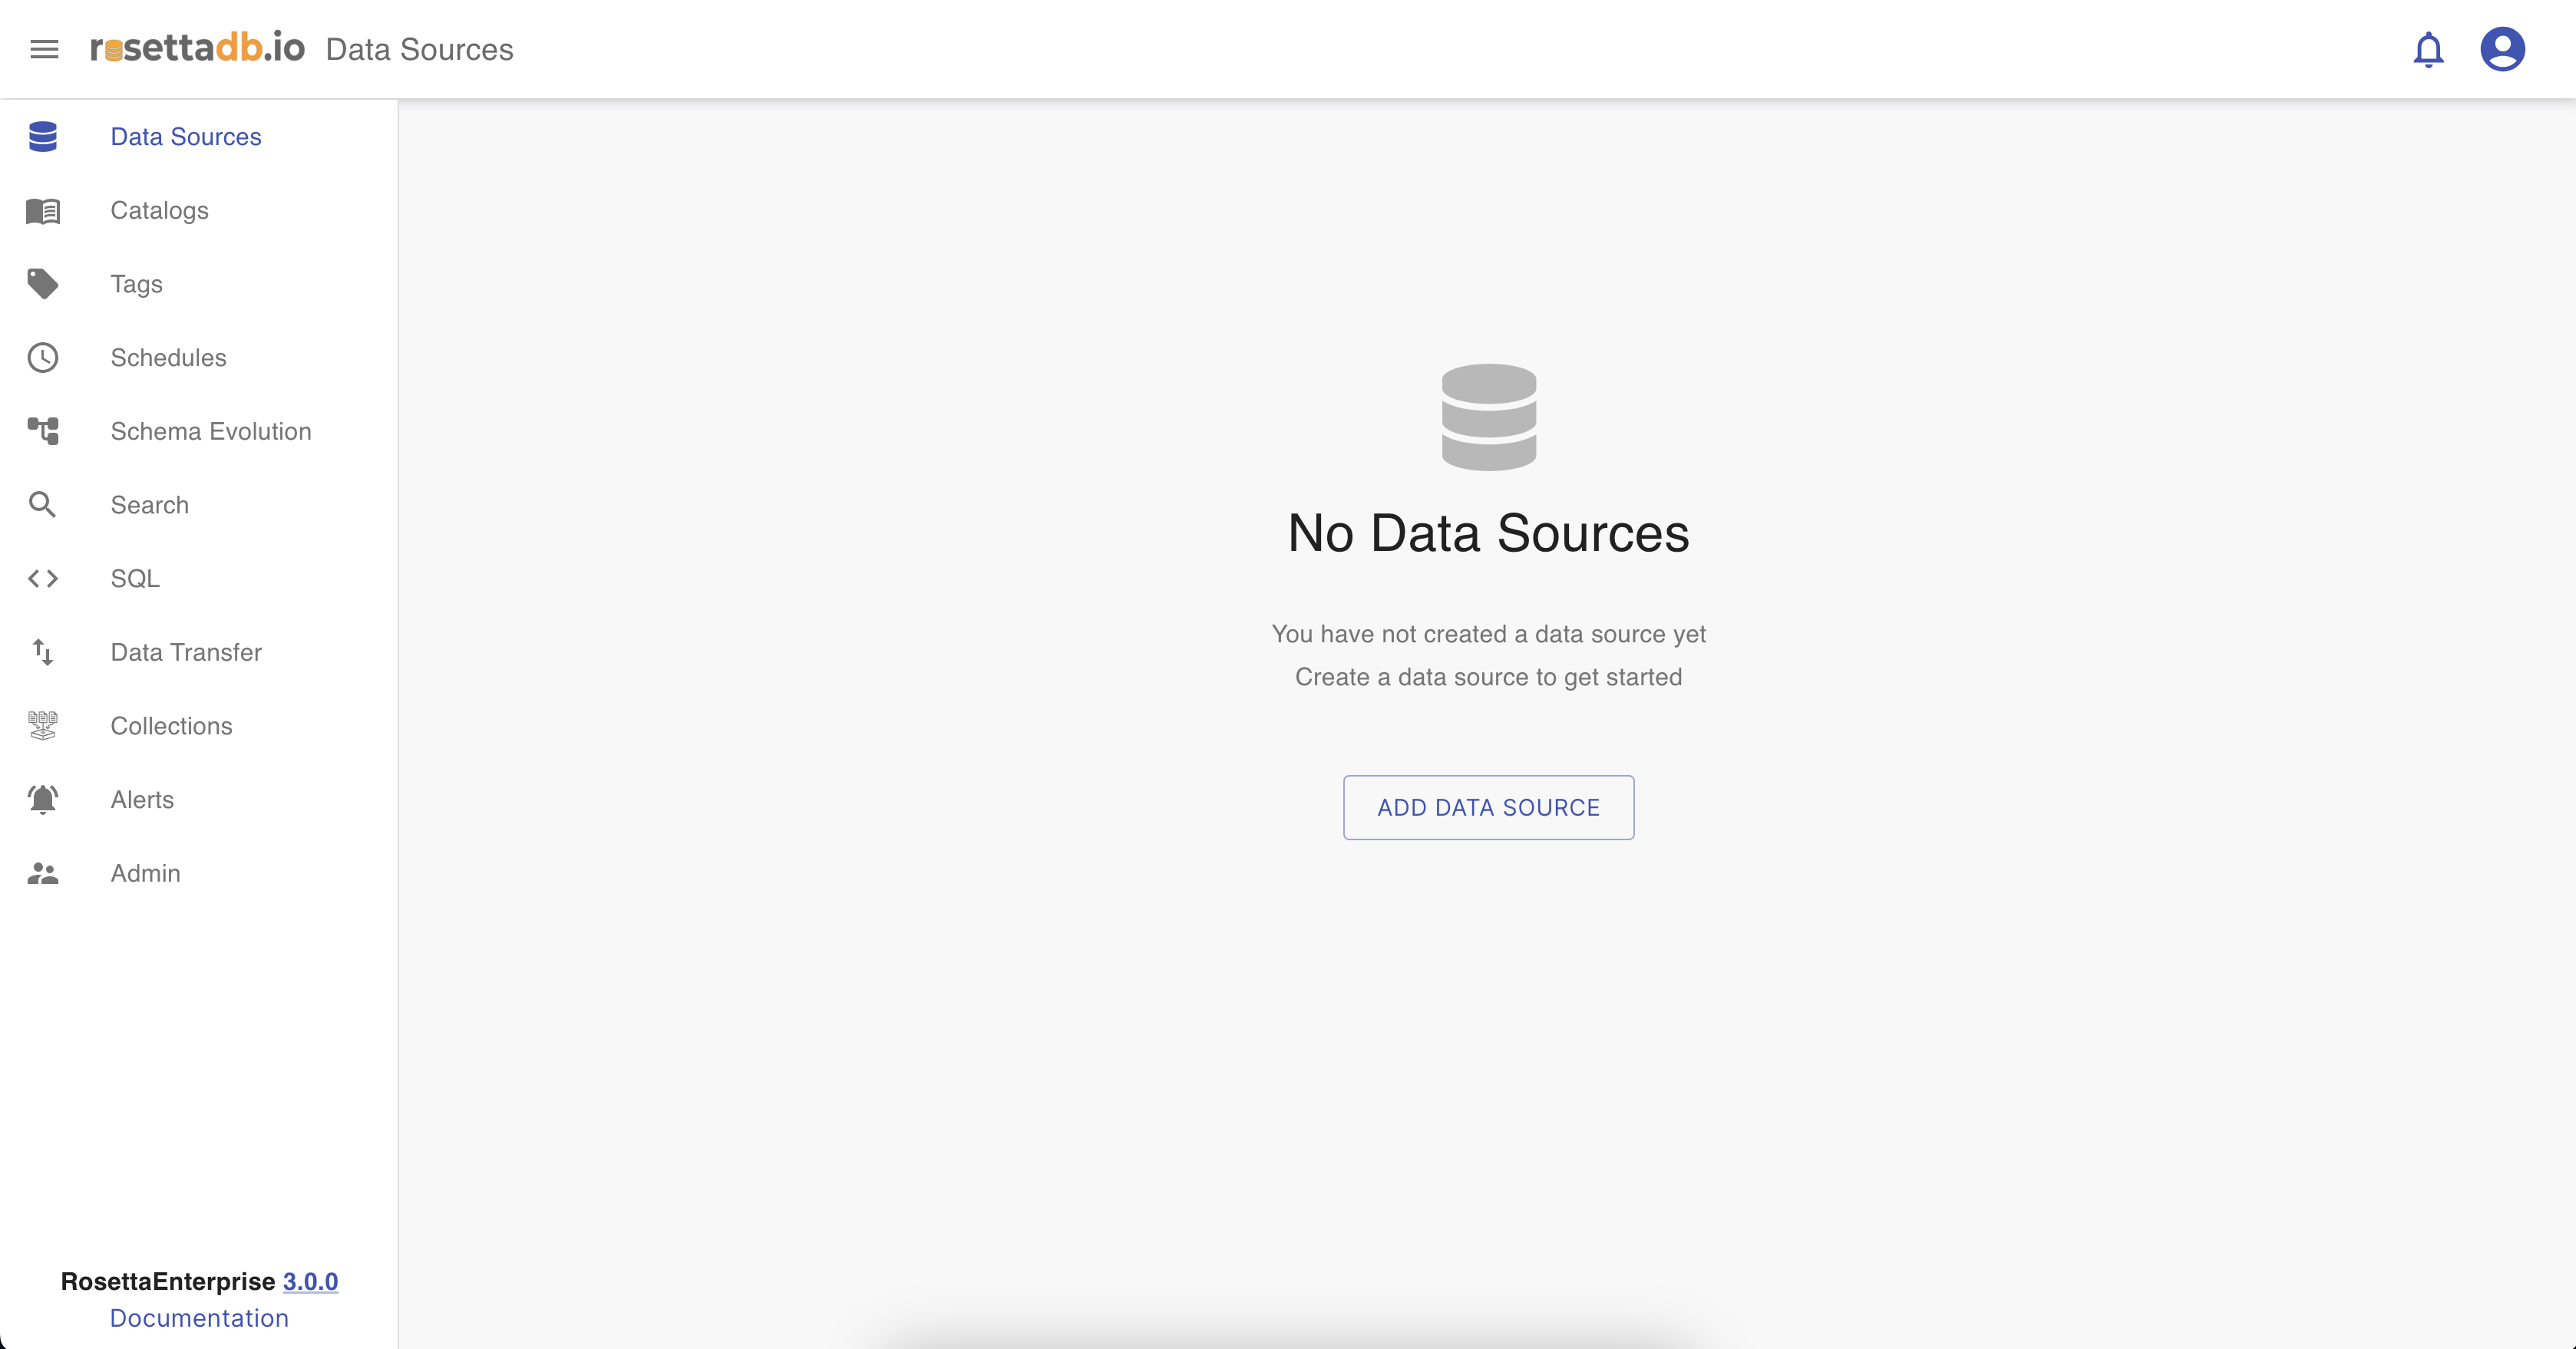
Users can click on the Data Source statistic button to create a new data source, which will redirect them to the Data source screen.
More on Data sources ...

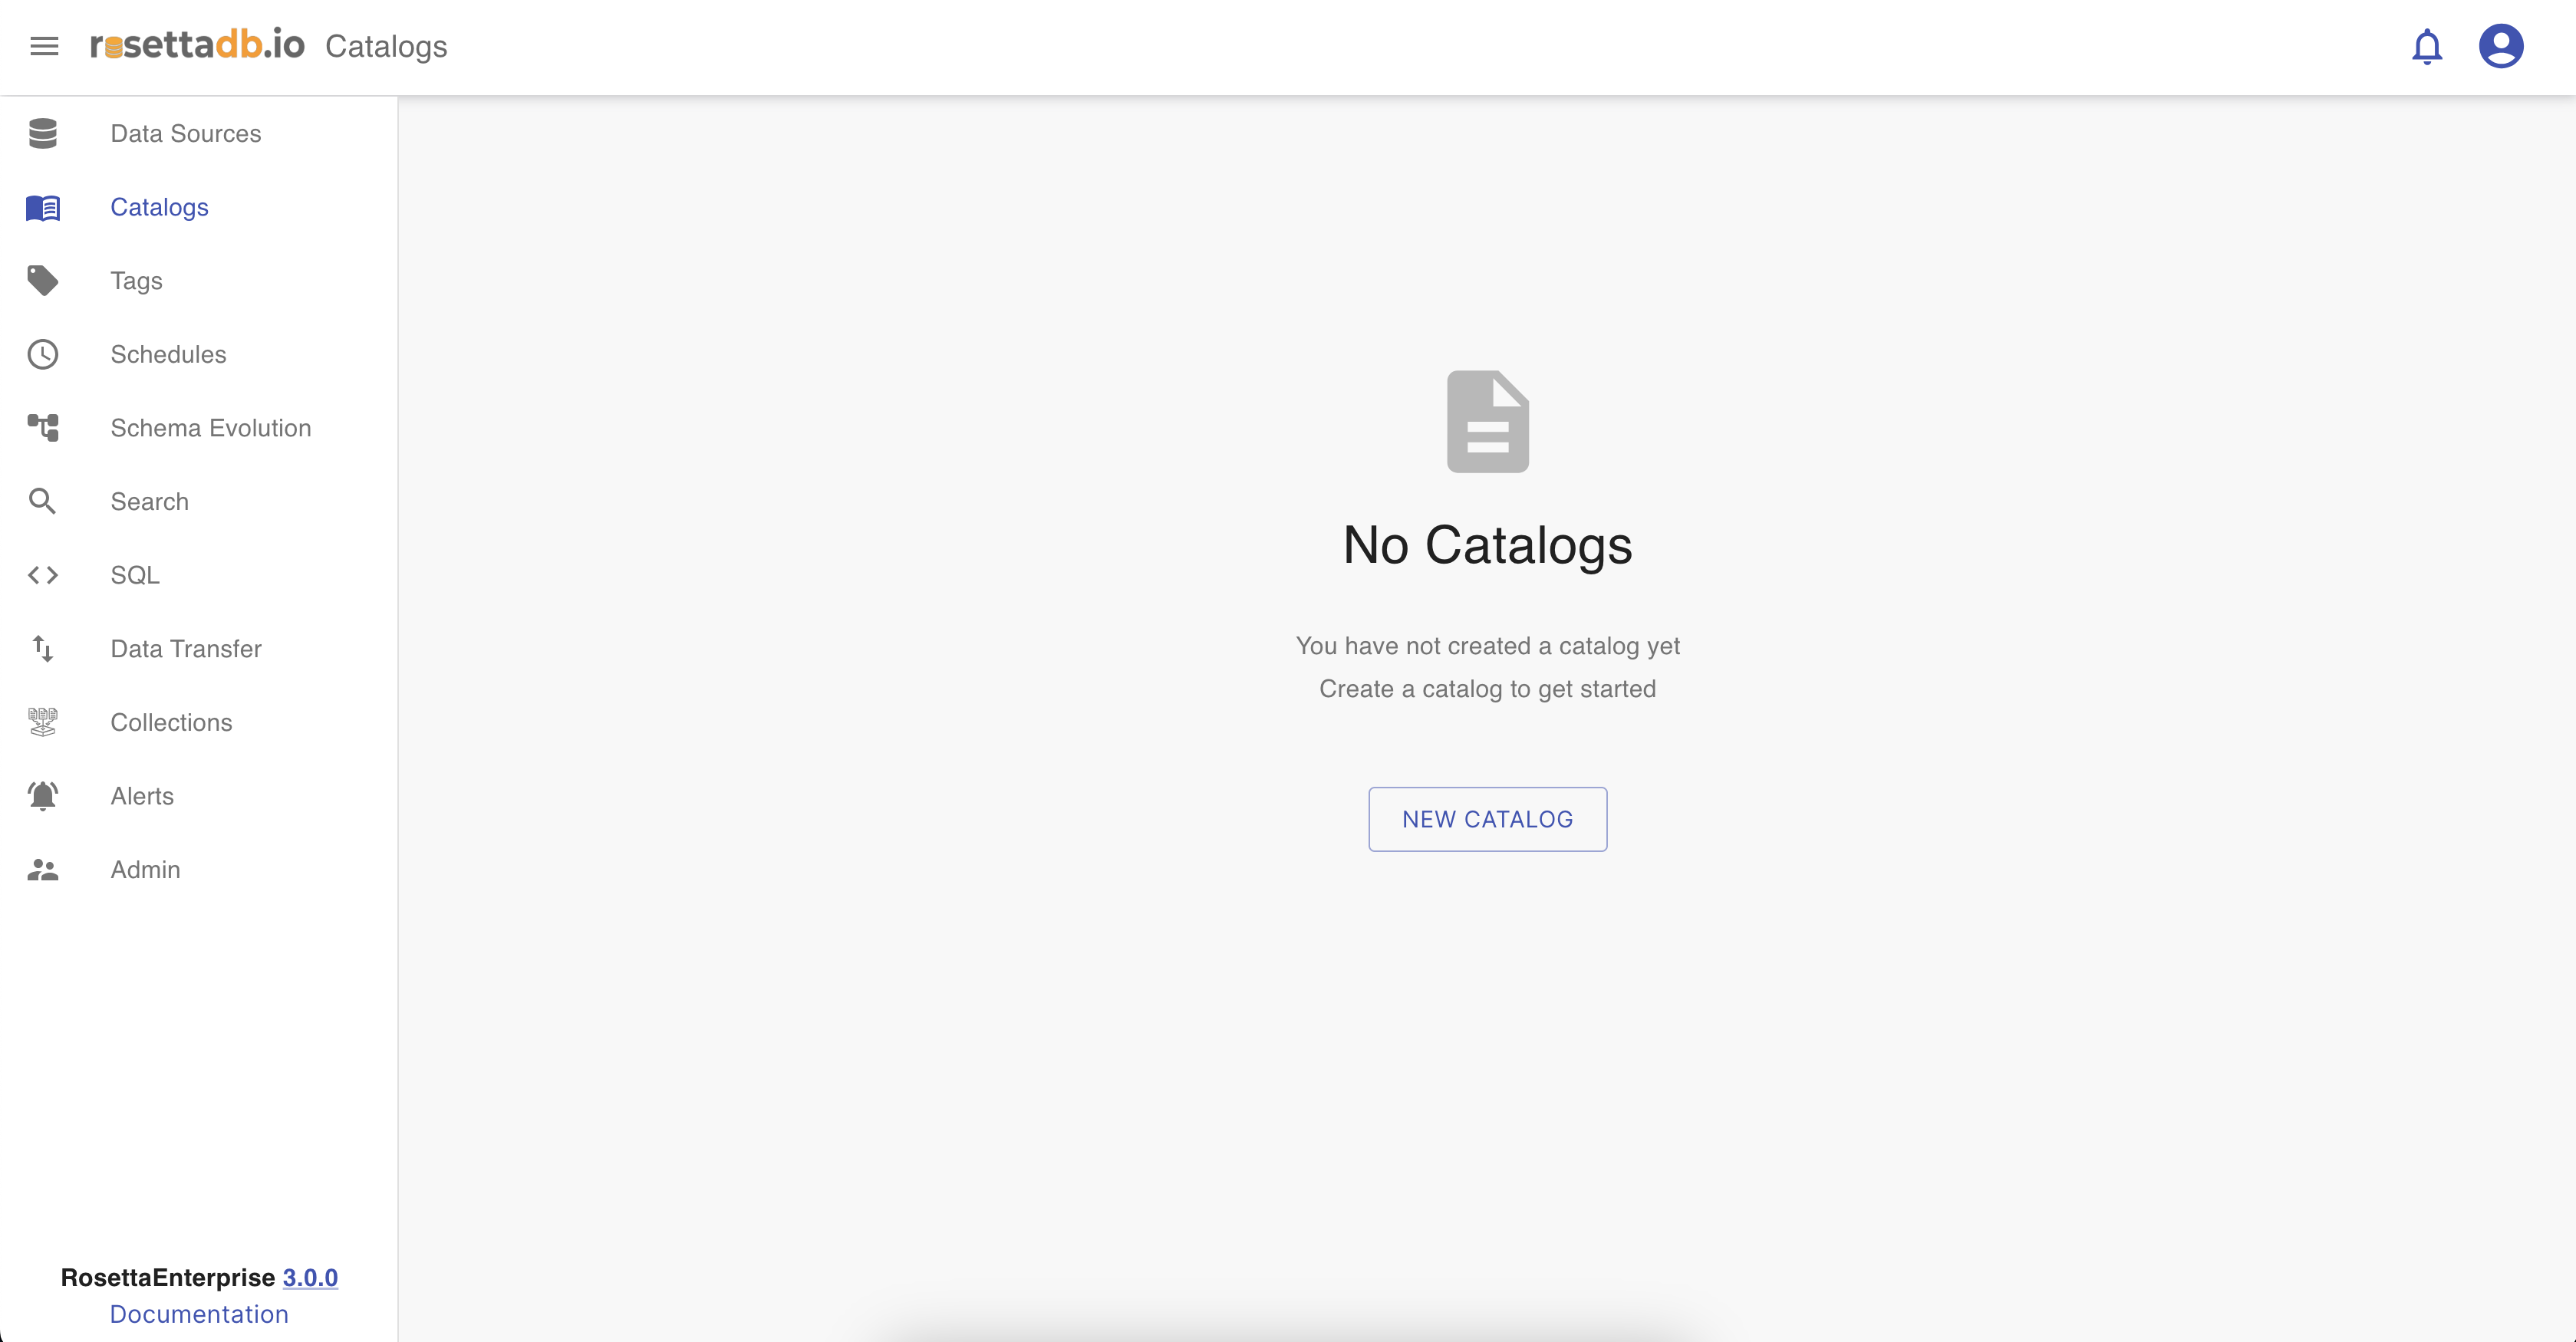
Similarly, users can click on the Catalogs statistic button to create a new catalog and browse the data, redirecting them to the Catalogs screen.
More on Catalogs ...

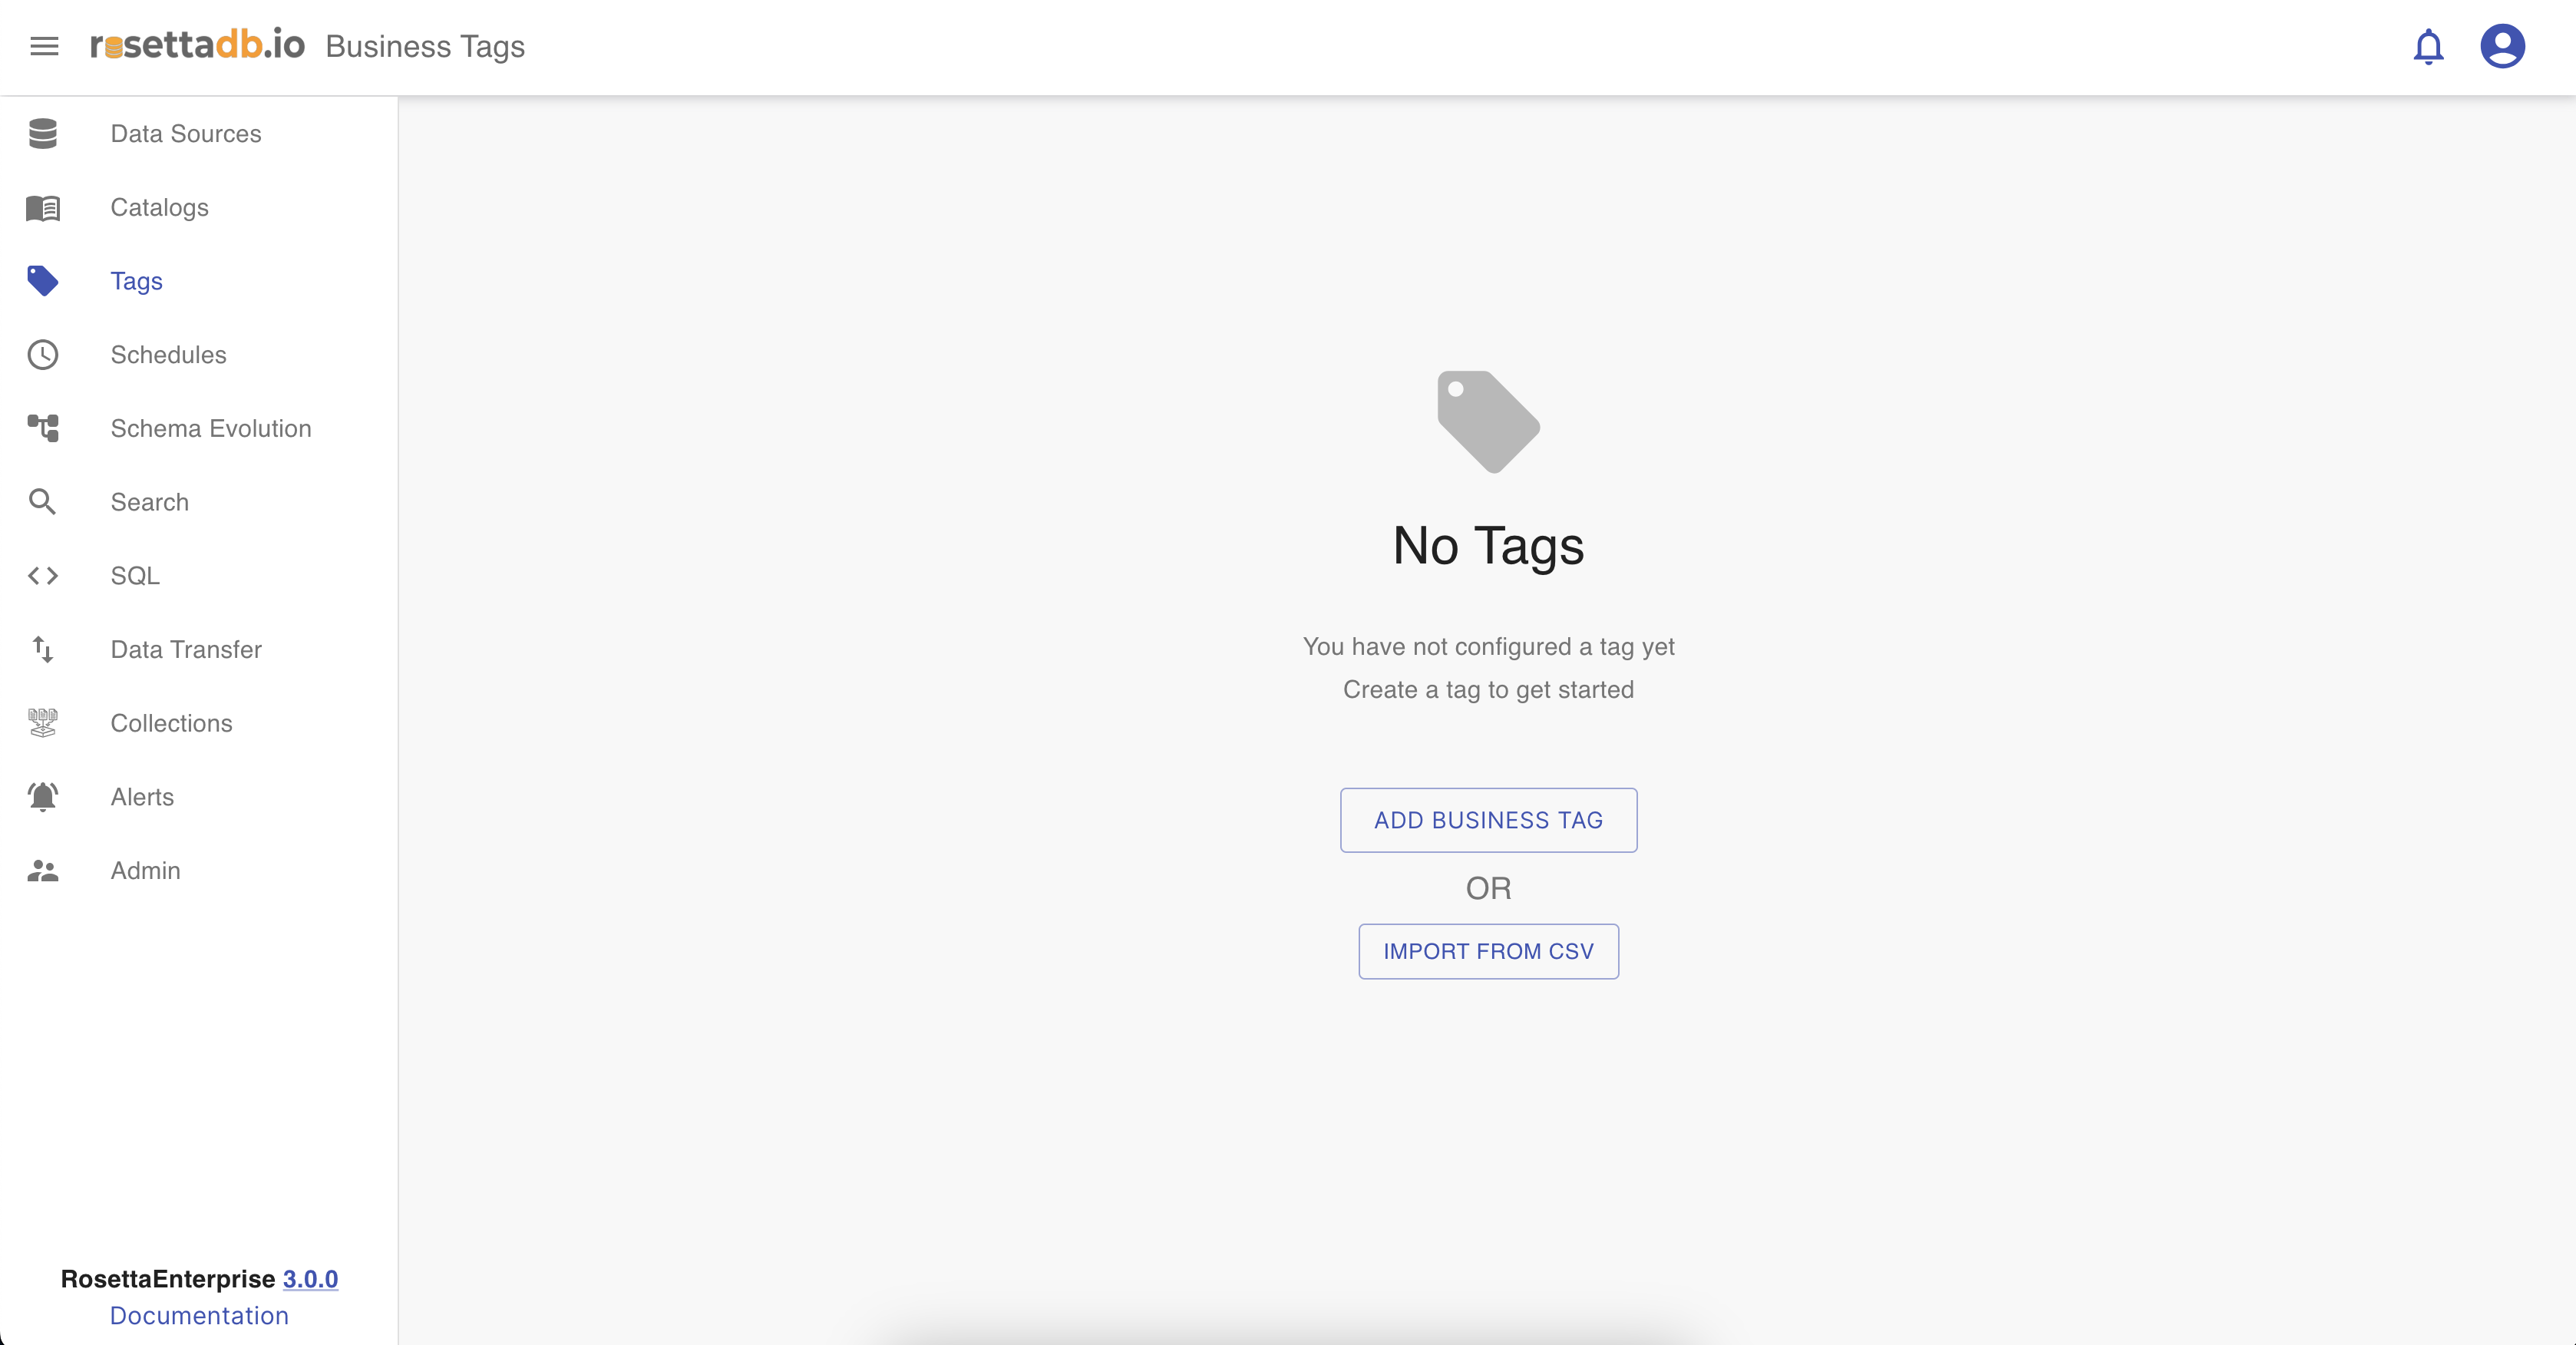
If users have already added a data source and a catalog, they can proceed to tag a table or column from the Business Tags category. Clicking on the Tags statistic button directs them to the tagging process, taking them to the Business Tags screen.
More on Business Tags...

To return to the dashboard, users can simply click on the Rosetta logo.